Knowledge Distribution
- File Ownership
- Orphaned Files
- Gini Coefficient
- Reading the Knowledge Matrix
- Knowledge Distribution in ContributorIQ
File Ownership
File ownership measures which contributors have the strongest claim to maintaining each file in the codebase. Using Degree of Authorship (DOA) analysis, ContributorIQ identifies:
- Primary owner: The contributor with the highest DOA score for each file
- Author count: How many contributors have significant knowledge (DOA > 0.75) of each file
- Single-author files: Files where only one contributor has meaningful ownership
A high percentage of single-author files indicates concentrated knowledge. If those authors depart, maintaining those files becomes difficult.
Orphaned Files
A file is considered orphaned when no currently active contributor (committed within the last year) has a DOA score above 0.5 for that file. Orphaned files represent code that nobody on the current team deeply understands.
Common causes of orphaned files:
- The original author departed and no one picked up maintenance
- The file was written by a contractor who is no longer engaged
- The file is legacy code that hasn't been modified in a long time
Orphaned files are not necessarily a crisis, but they are a risk. If a bug is found in an orphaned file, fixing it will require more effort because no one has context. During M&A, a high orphaned file count raises questions about maintainability.
Gini Coefficient
The Gini coefficient measures how evenly commits are distributed across contributors in a repository. Borrowed from economics (where it measures income inequality), it provides a single number that summarizes knowledge concentration:
| Gini | Interpretation |
|---|---|
| 0.0 | Perfect equality, where all contributors commit equally |
| 0.0-0.3 | Low concentration, meaning knowledge is well distributed |
| 0.3-0.5 | Moderate concentration, where some contributors dominate |
| 0.5-0.7 | High concentration, where a few contributors do most of the work |
| 0.7-1.0 | Very high concentration, essentially single-contributor |
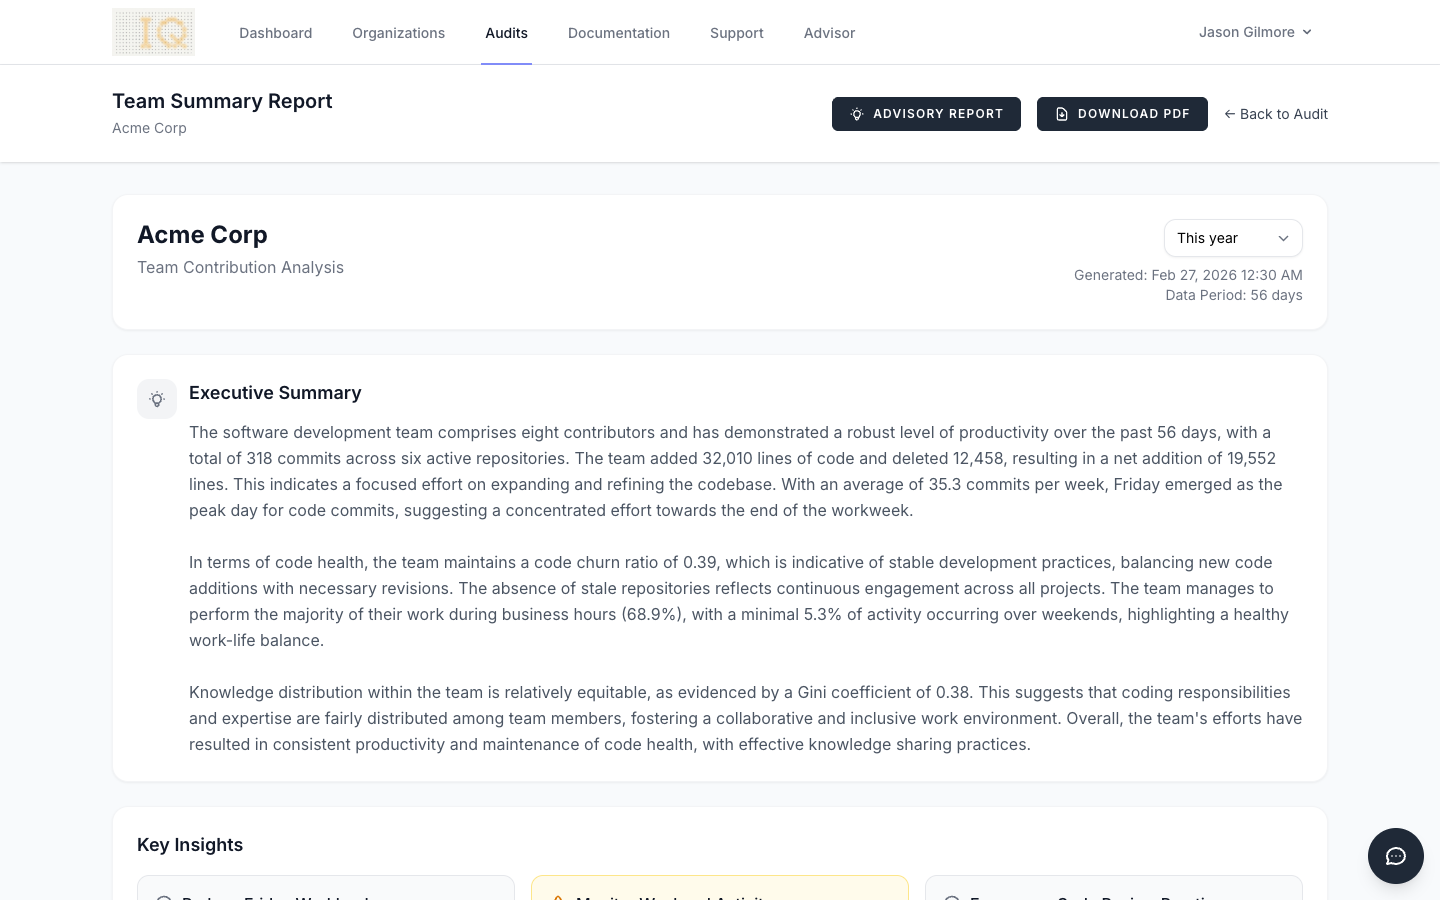
A Gini coefficient of 0.6 means the commit distribution is comparable to a moderately unequal economy. Most open-source projects have high Gini coefficients (0.7+). Internal teams should aim for lower values.
The organization-level Gini is the average across all repositories, giving an overall sense of how concentrated knowledge is across the engineering team.
Reading the Knowledge Matrix
The knowledge distribution heatmap on the risk dashboard shows SME (Subject Matter Expert) scores in a matrix of repositories vs. contributors. Darker cells indicate higher expertise.
Key patterns to look for:
- Vertical stripes: A single contributor has high scores across many repositories, indicating a key person dependency
- Horizontal stripes: A single repository has high scores from only one contributor, indicating a low bus factor
- Diagonal clusters: Teams working on specific repositories together, which is healthy
- Sparse rows: Repositories with few contributors having any expertise, which are high-risk
The matrix shows only the top repositories and contributors by commit count. Smaller repositories and less active contributors are excluded for readability.
Knowledge Distribution in ContributorIQ
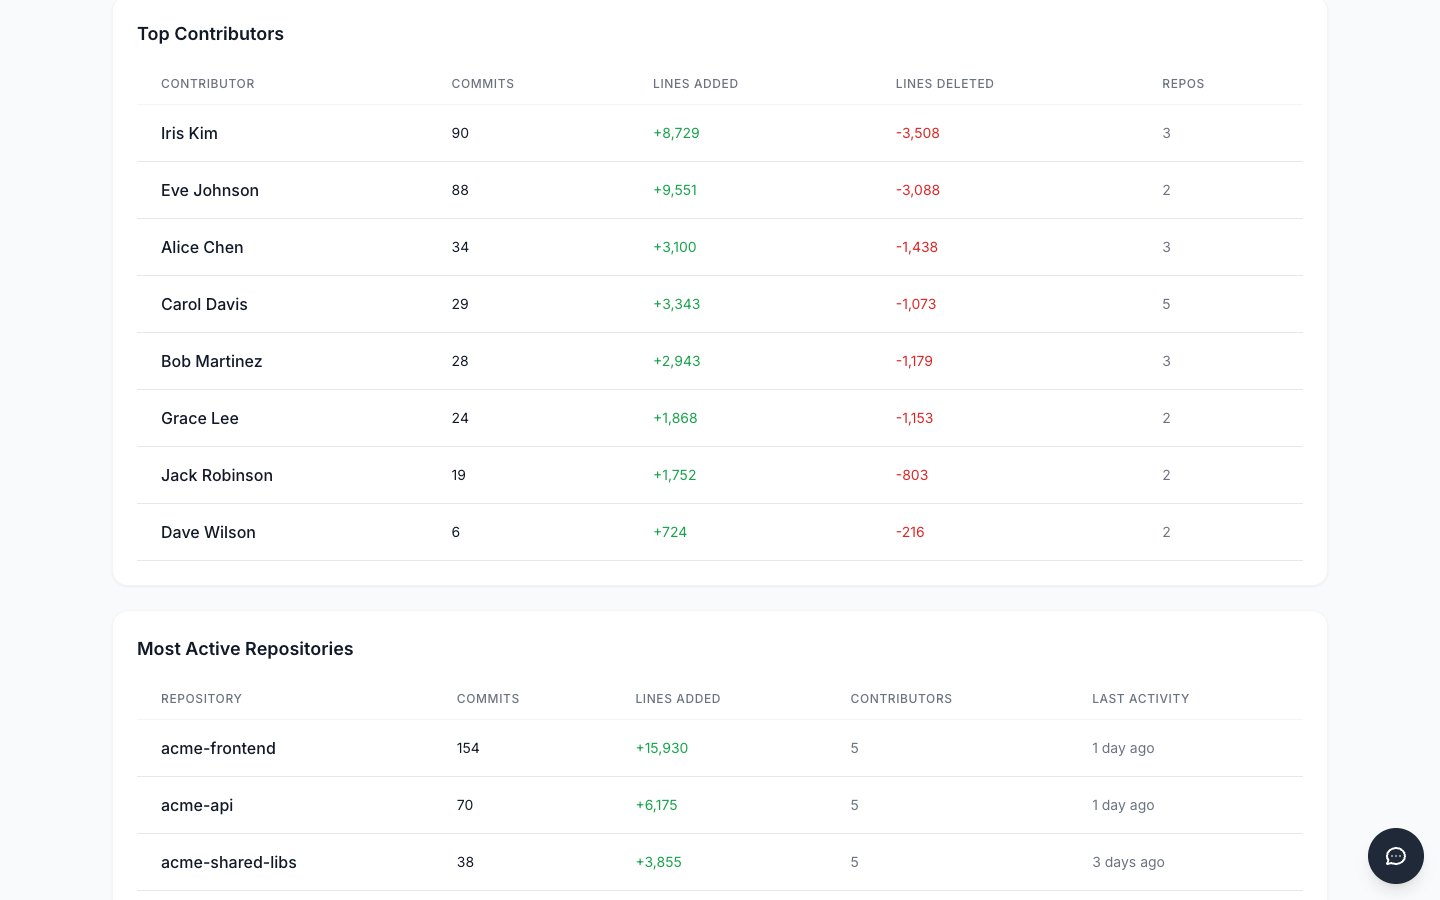
The Team Summary report surfaces knowledge distribution metrics, including the Gini coefficient and bus factor, alongside contributor rankings that show how commits and code ownership are spread across your team.
The Top Contributors table ranks team members by commit count and shows the breadth of their involvement across repositories. This makes it straightforward to identify both vertical stripes (key person dependencies) and healthy diagonal clusters (focused team ownership).