Organization Health Score
- What the Health Score Measures
- How Individual Metrics Roll Up
- Interpreting the Score
- Using Health Scores for Due Diligence
- The Risk Summary
- Health Scores in ContributorIQ
What the Health Score Measures
The organization health score is a composite metric (0-100) that rolls up multiple risk and distribution indicators into a single number. It answers the question: "How resilient is this engineering organization to contributor changes?"
A higher score indicates better health: more distributed knowledge, higher bus factors, and more active contributors.
How Individual Metrics Roll Up
Each repository receives a health score based on four equally-weighted factors (25 points each):
Bus Factor Score (0-25)
Based on the DOA-calculated bus factor. Each bus factor point adds 5 points, up to 25. A bus factor of 5+ earns the maximum score.
Single Author Score (0-25)
Penalizes repositories where many files have only one significant author. A repository where 100% of files are single-author scores 0; a repository with 0% single-author files scores 25.
Gini Score (0-25)
Penalizes uneven commit distribution. A Gini coefficient of 0 (perfect equality) scores 25; a Gini of 1 (total inequality) scores 0.
Activity Score (0-25)
Based on the number of contributors who have committed in the last 30 days. Each active contributor adds 5 points, up to 25.
The organization health score is the average of all repository health scores.
Interpreting the Score
| Score | Level | Meaning |
|---|---|---|
| 75-100 | Healthy | Knowledge is well-distributed, bus factors are adequate, teams are active |
| 50-74 | Moderate | Some concentration risks exist but overall resilience is acceptable |
| 25-49 | At Risk | Significant knowledge concentration; multiple single-points-of-failure |
| 0-24 | Critical | Severe dependency on very few contributors; high organizational risk |
Using Health Scores for Due Diligence
When evaluating an engineering organization:
- Compare health scores across repositories, because a single low-scoring critical repository is more concerning than several low-scoring utilities
- Cross-reference with lifecycle data, since a moderate health score combined with many "winding down" contributors is worse than the score alone suggests
- Track trends by running audits periodically to see if health scores are improving or declining
- Consider context, because a new organization with many "ramping up" contributors will naturally have lower scores that should improve over time
The Risk Summary
The organization metric summary includes:
- Total repos analyzed: How many repositories were included in the assessment
- Total files analyzed: The sum of unique files across all repositories
- Orphaned files: Files with no active contributor having significant ownership
- Top risk repos: Repositories with a bus factor of 1 or 2
These numbers provide context for the health score. An organization with 100 repositories and 5 orphaned files is in a very different situation than one with 10 repositories and 5 orphaned files.
Health Scores in ContributorIQ
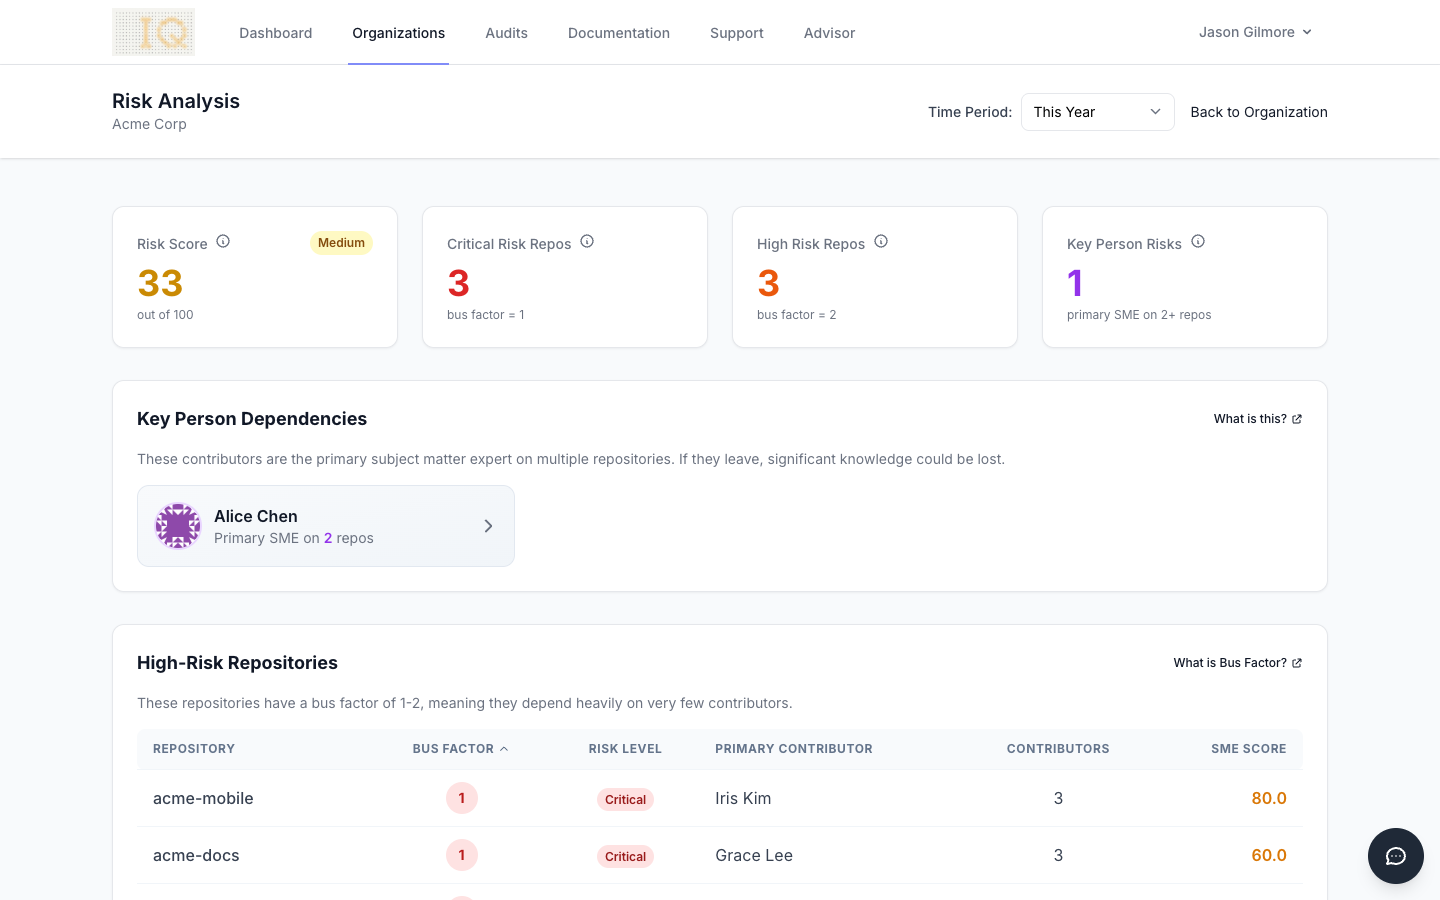
The Organization Risk dashboard presents your health score alongside the risk score, bus factor, and repository breakdown. Each metric links to more detailed views so you can drill into the underlying data.
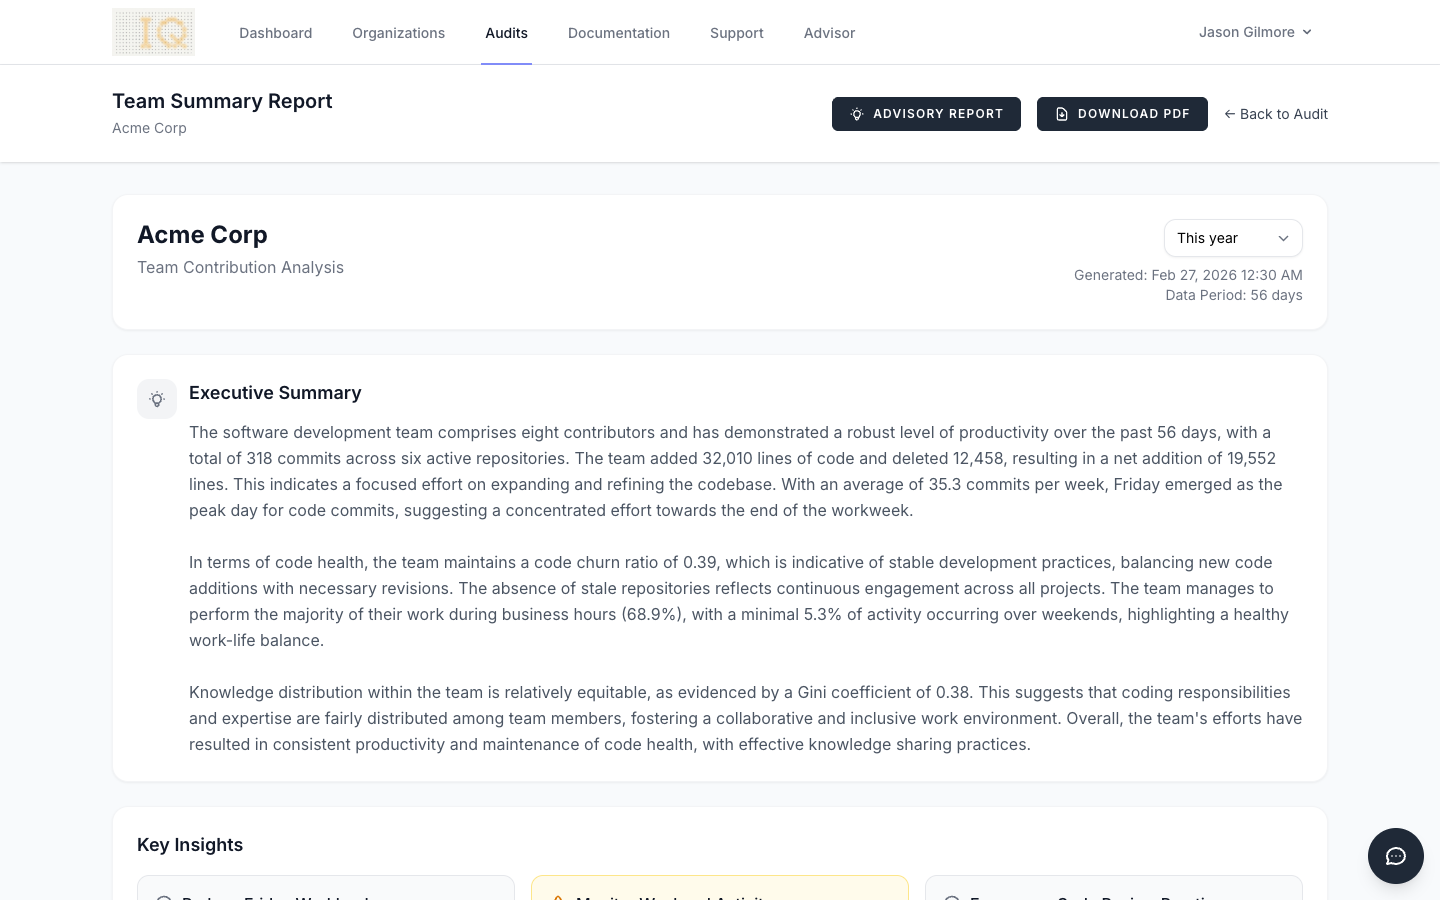
The Team Summary report provides additional context by combining health metrics with work patterns, code churn data, and contributor activity trends over time.