Gini Coefficient for Code: Measure Contribution Equality
The Gini coefficient quantifies how evenly commits are distributed across your team. How to calculate Gini for code, interpret the score, and act on it.
- Introduction
- Understanding the Gini Coefficient
- What the Calculation Actually Shows
- Interpreting Your Team's Score
- When High Gini Is Problematic
- When Low Gini Is Valuable
- Using Gini for Different Purposes
- Gini in M&A Due Diligence
- Improving Your Gini Coefficient
- Combining Gini with Other Metrics
- Limitations to Acknowledge
- How ContributorIQ Tracks Contribution Distribution
- Conclusion
Introduction
Economists have spent decades measuring inequality, specifically how evenly wealth and income are distributed across populations. The most common tool for this measurement is the Gini coefficient, a single number that captures the entire shape of a distribution.
Software engineering teams have borrowed this tool because they face a similar question: how evenly are contributions distributed across your team? When a few developers do most of the work while others contribute minimally, you face knowledge concentration, key person dependencies, and organizational risk. The Gini coefficient makes this distribution visible and measurable.
Understanding the Gini Coefficient
The Gini coefficient produces a number between 0 and 1 that describes how equal or unequal a distribution is. At 0, you have perfect equality, where everyone has exactly the same amount. At 1, you have total inequality, where one person has everything while everyone else has nothing.
In economics, countries with Gini coefficients around 0.25 have relatively equal income distributions (think Nordic countries), while coefficients above 0.60 indicate high inequality. Most real-world distributions fall somewhere in the middle.
When applied to engineering teams, the Gini coefficient measures commit distribution. A coefficient of 0 would mean every contributor has exactly the same number of commits, representing perfect equality. A coefficient of 1 would mean one person made every commit while others contributed nothing. Most teams fall between 0.3 and 0.7.
What the Calculation Actually Shows
The mathematics behind Gini involve comparing the actual distribution of contributions to what a perfectly equal distribution would look like. Imagine sorting your contributors from lowest to highest commit count, then plotting cumulative contribution percentages. In perfect equality, the bottom 50% of contributors would account for 50% of commits. The more the actual distribution deviates from this ideal, the higher the Gini coefficient.
This matters because it captures the overall shape of contribution patterns, not just the top or bottom. A team might have one highly productive contributor without necessarily having problematic concentration, because it depends on how the rest of the team contributes. The Gini coefficient considers everyone.
Interpreting Your Team's Score
Gini coefficients below 0.3 indicate low concentration. Contributions are well-distributed, with everyone participating at roughly similar levels. This pattern is common in mature teams with strong collaborative cultures.
Coefficients between 0.3 and 0.5 indicate moderate concentration. Some senior contributors do more than others, which is often natural and healthy, but work remains spread across the team. This is a typical range for healthy teams.
Coefficients between 0.5 and 0.7 indicate high concentration. A few contributors dominate output while others contribute minimally. This raises questions about knowledge distribution, key person dependencies, and team scalability.
Coefficients above 0.7 indicate very high concentration, essentially a single contributor or founder-dominated pattern. This is common and acceptable in early-stage startups but becomes concerning as organizations grow and the concentrated knowledge becomes harder to distribute.
When High Gini Is Problematic
High Gini coefficients can signal several underlying problems. Knowledge concentration in few individuals means most of the team lacks deep familiarity with the codebase. Key person dependencies emerge when most understanding lives in a handful of heads. Development bottlenecks form when the few high contributors become overwhelmed with requests. The team struggles to scale because adding headcount doesn't distribute work without effort.
However, high Gini isn't automatically bad. Early-stage startups naturally have high concentration because founders built everything. Technical leads legitimately contribute more than juniors they're mentoring. Some degree of variation is expected and healthy, and the goal isn't forcing artificial equality.
The context matters enormously. A Gini of 0.6 in a three-person startup is fundamentally different from the same coefficient in a twenty-person team that's been operating for years.
When Low Gini Is Valuable
Low Gini coefficients generally indicate good things. Knowledge is well-distributed across the team, reducing key person risk. The team can absorb departures without major disruption. Collaboration patterns are healthy, with multiple people touching shared code. Onboarding tends to work well because knowledge isn't locked up in isolated experts.
However, very low Gini can raise its own questions. Is the equal distribution natural, or is it artificially forced through mandated rotation that ignores expertise? Does the evenness mask quality differences in contributions? Might the equality reflect lack of ownership, where no one takes responsibility for anything in particular?
The healthiest teams typically have Gini coefficients in the moderate range, with some natural variation based on seniority and specialization, but not dangerous concentration.
Using Gini for Different Purposes
At the repository level, calculate Gini for each repository separately. This reveals which codebases have concerning concentration and where knowledge transfer efforts should focus. Some repositories naturally have higher concentration (a specialized tool maintained by one team) while others should have broad participation (your core product).
At the organization level, calculate Gini across all commits to produce a single number for executive-level reporting. This enables comparison across organizations (valuable in M&A due diligence) and tracking trends over time. Is your organization becoming more or less distributed?
With time filtering, calculate Gini for specific periods: the last 90 days shows current state, the last year shows medium-term patterns, and year-over-year comparison reveals trends. A Gini that's increasing over time suggests growing concentration that might warrant intervention.
Gini in M&A Due Diligence
When evaluating acquisition targets, Gini provides a quick read on engineering team health. A target with Gini below 0.5 suggests healthy distribution and lower post-deal risk. Coefficients between 0.5 and 0.7 indicate moderate concentration worth investigating: who are the key contributors, and are they staying?
Targets with Gini above 0.7 present significant key person risk that should factor into both valuation and retention planning. If most of the codebase was built by two people, your acquisition depends heavily on whether those two people stay.
Gini works best as part of a broader health assessment. Combine it with bus factor for direct departure risk measurement, lifecycle analysis for engagement patterns, and orphaned file tracking for knowledge gaps.
Improving Your Gini Coefficient
Short-term actions focus on distributing work more thoughtfully. Assign tasks to less-active contributors rather than defaulting to whoever already knows the most. Require diverse code reviewers to build understanding across the team. Rotate ownership on new features instead of giving them to the usual experts. Practice pair programming, which naturally spreads knowledge with every session.
Longer-term strategies address the patterns that create concentration. Improve onboarding so new engineers become productive contributors faster. Incentivize knowledge sharing through recognition and career advancement criteria. Hire strategically to fill gaps rather than just adding capacity. Build a culture where collaboration is the norm rather than the exception.
Avoid gaming the metric. Trivial commits made solely to inflate counts hurt code quality without improving knowledge distribution. Forced rotation without building understanding creates problems rather than solving them. Artificial equality isn't the goal; resilience is.
Also avoid punishing high performers. Senior contributors should contribute more; that's expected. The goal is building backup capacity and distributing knowledge, not reducing the output of your best people.
Combining Gini with Other Metrics
Gini alone doesn't tell the full story. The most insight comes from combining it with other measures.
High Gini combined with low bus factor (1-2) is dangerous, as knowledge is concentrated and fragile. High Gini with high bus factor (4+) is unusual and worth investigating; how can contribution be concentrated but coverage broad?
Low Gini combined with low bus factor suggests moderate risk, where work is distributed but coverage is thin. Low Gini with high bus factor represents healthy teams with distributed contributions and depth of coverage.
Gini combined with lifecycle analysis adds timing context. High Gini with key contributors classified as "Winding Down" represents urgent risk, because the concentration is about to walk out the door.
Consider team size when interpreting Gini. A 3-person team with Gini of 0.4 might be fine, while a 20-person team with the same coefficient likely has too much concentration.
Limitations to Acknowledge
Gini measures quantity, not quality. A hundred trivial commits don't equal ten major features, but Gini treats them the same. This is why Gini works best alongside metrics like Degree of Authorship that consider contribution significance.
Non-code contributions don't appear in Gini. Architecture decisions, mentoring, documentation, and coordination all contribute to team success without generating commits. Gini captures coding patterns, not full contributor value.
Some concentration is necessary. Specialized roles like DevOps or security engineering naturally have different commit patterns. Project phases matter too. Greenfield development naturally concentrates in creators, while maintenance tends to distribute.
Use Gini as one signal among several. Combine it with qualitative assessment from team leads, other quantitative metrics, and understanding of your specific context. No single number captures everything about team health.
How ContributorIQ Tracks Contribution Distribution
Calculating Gini coefficients by hand requires extracting commit data from every repository, normalizing contributions across different time periods, and running the statistical analysis yourself. ContributorIQ handles all of this automatically. Once connected to your GitHub organization, it computes Gini coefficients at both the repository and organization level, updating continuously as new commits arrive.
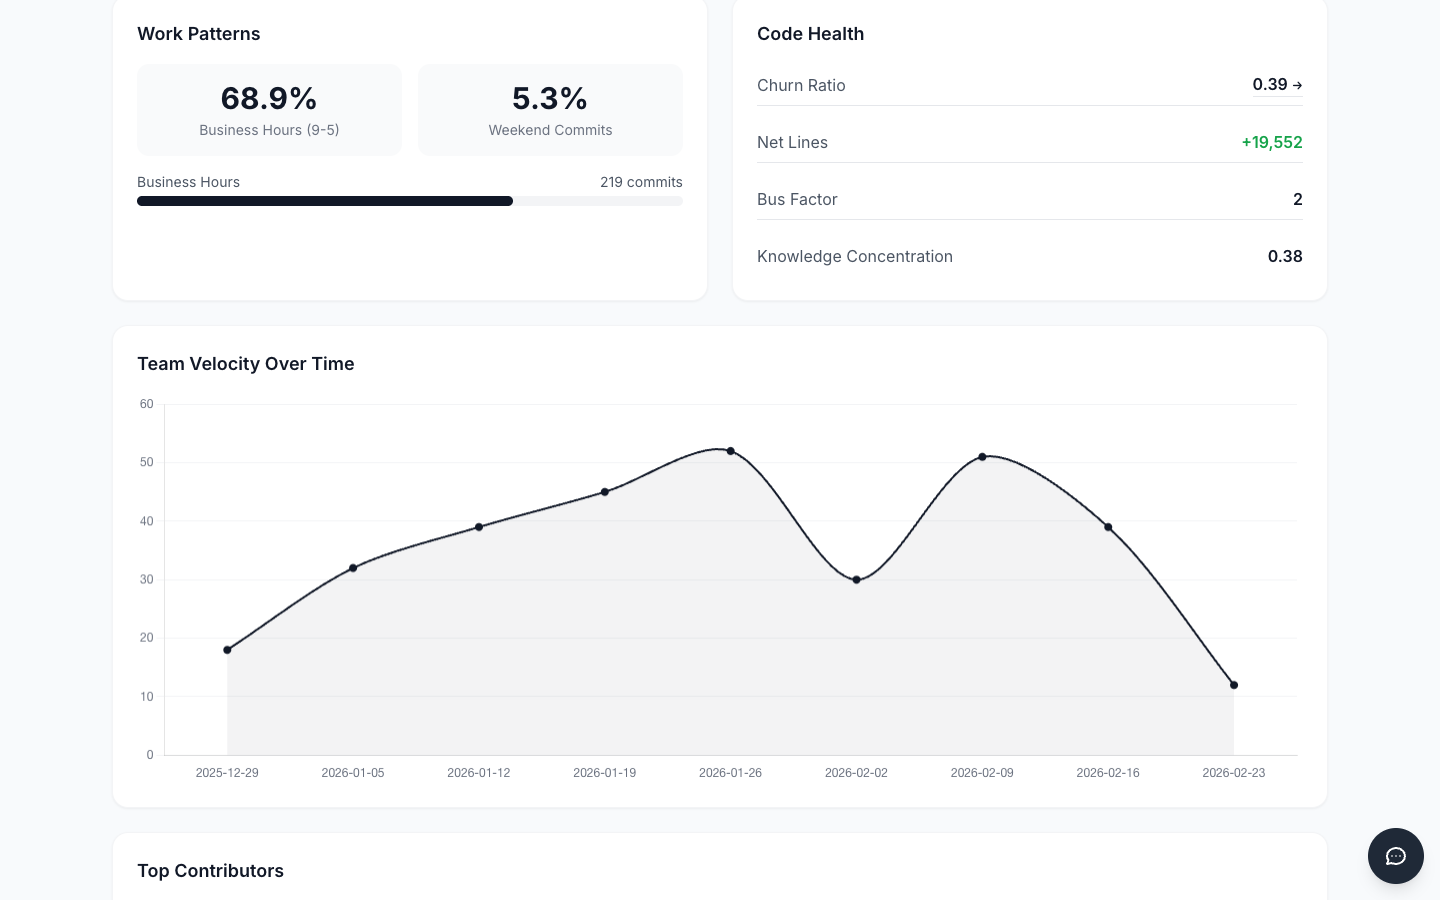
The team summary view displays Gini coefficients alongside other key health indicators, giving managers an at-a-glance understanding of how evenly work is distributed. You can drill into specific repositories to see which contributors are driving concentration, and track whether your efforts to distribute work more evenly are producing results over time.
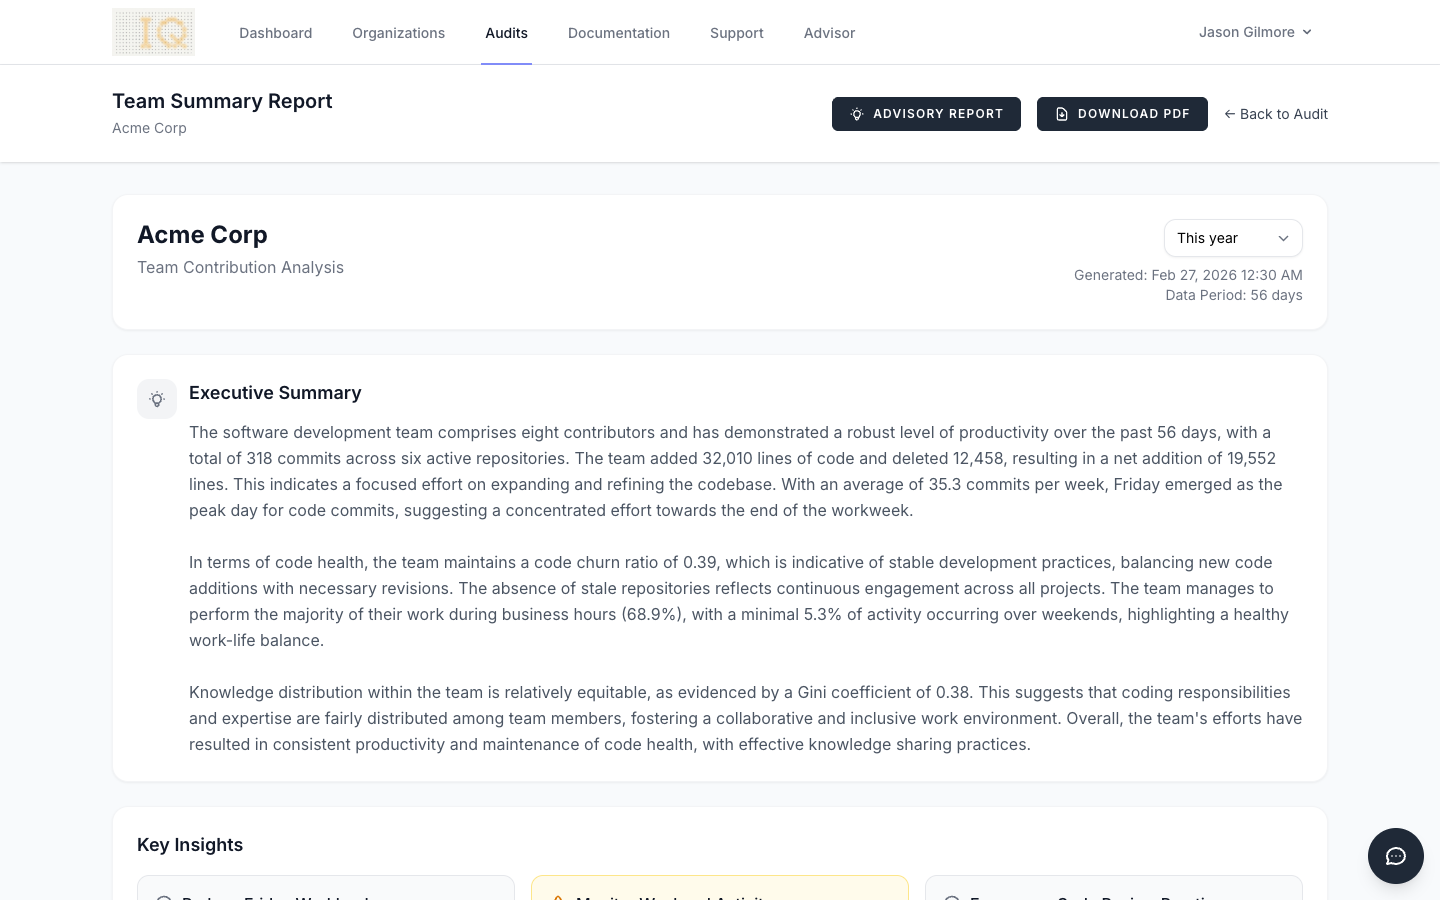
ContributorIQ also surfaces work pattern analytics that add context to the Gini numbers. The work patterns view reveals when contributions happen (weekdays versus weekends, business hours versus after hours), helping you understand whether high concentration correlates with unsustainable work habits. This pairing of distribution metrics with sustainability signals gives a more complete picture than either metric provides alone.
Conclusion
The Gini coefficient provides a powerful lens for understanding contribution distribution in your engineering organization. By adapting an economic tool to measure commit inequality, you can identify concentration risks, track improvement over time, compare organizations for benchmarking or due diligence, and guide interventions for building resilience.
The goal isn't perfect equality, as that would ignore natural variation in seniority, specialization, and productivity. The goal is appropriate distribution that builds organizational resilience while allowing individual contribution patterns to reflect real differences in role and capability.
Use Gini as one tool in your measurement toolkit, interpret it with context, and act on what it reveals about where knowledge lives in your organization.