Engineering Health Metrics: 12 KPIs That Predict Risk
Velocity is not health. Twelve engineering organization health metrics covering bus factor, knowledge distribution, lifecycle, and burnout signals.
- Introduction
- The Limitations of Traditional Metrics
- Four Dimensions of Engineering Health
- Resilience Metrics
- Distribution Metrics
- Engagement Metrics
- Sustainability Metrics
- Building a Composite Health Score
- Implementing Health Metrics
- Measuring Organization Health with ContributorIQ
- Tools for Tracking Engineering Health Across Organizations
- Conclusion
Introduction
Most engineering organizations measure velocity: story points completed, tickets closed, features shipped. Velocity matters, but it's not the whole picture.
A team can have impressive velocity while accumulating knowledge debt that will slow them later. They can ship features while creating single points of failure that make the codebase fragile. They can hit sprint goals while burning out key contributors whose eventual departure will hurt far more than any short-term gains.
Health metrics capture what velocity misses: the sustainability and resilience of your engineering organization. They answer not just "how fast are we going?" but "can we maintain this pace?" and "what happens if someone leaves?"
The Limitations of Traditional Metrics
Velocity metrics have well-known problems. Story points are gameable, since teams learn to estimate higher and then complete what they estimated, showing "improvement" that reflects calibration rather than capability. High velocity doesn't measure sustainability; a team running at 150% capacity shows high velocity right up until burnout hits and productivity collapses. And high velocity can mask growing risk, because shipping fast doesn't mean shipping safe.
Traditional metrics also miss important dimensions entirely. They don't capture whether understanding is spread across the team or concentrated in a few people. They don't reveal whether the team can absorb departures without crisis. They don't show whether contributors are engaged and ramping up or disengaging and winding down. They don't signal whether the current pace is maintainable over months and years.
Health metrics fill these gaps.
Four Dimensions of Engineering Health
A comprehensive view of engineering health covers four dimensions: resilience, distribution, engagement, and sustainability.
Resilience answers the question: can the team absorb change? When someone leaves, gets promoted, or goes on extended leave, does work continue smoothly or does everything stall?
Distribution asks: is knowledge spread appropriately? Are multiple people familiar with critical systems, or does understanding concentrate in isolated individuals?
Engagement examines: are contributors actively involved? Are people ramping up and reaching full productivity, maintaining peak performance, or showing signs of disengagement?
Sustainability investigates: is the pace maintainable? Is the team working reasonable hours, or are patterns suggesting burnout risk?
Resilience Metrics
Bus Factor
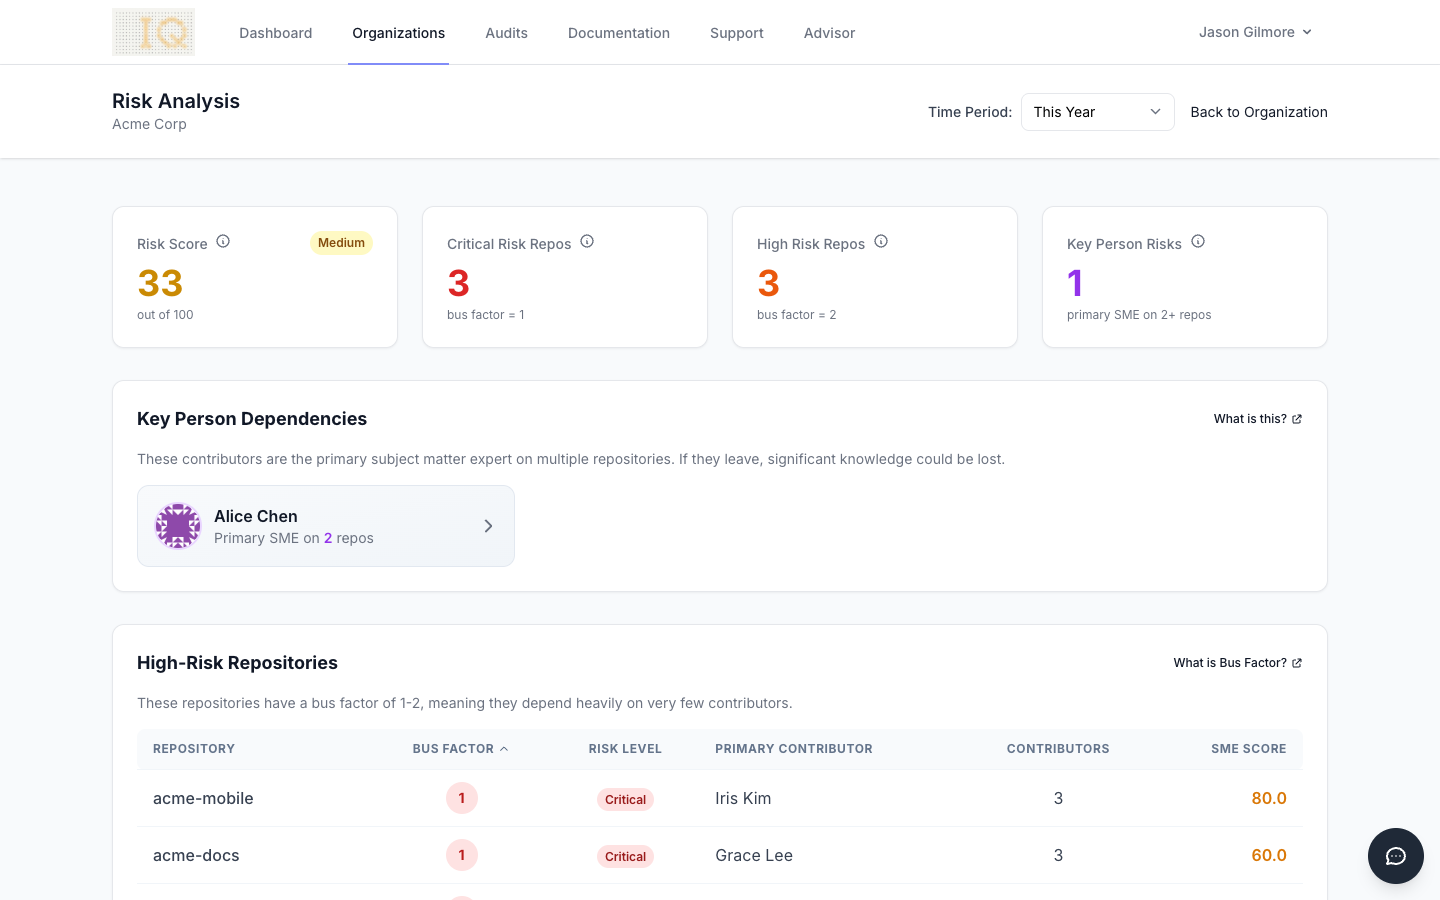
Bus factor measures the minimum number of contributors who would need to leave before a project stalls. It's calculated using Degree of Authorship (DOA) analysis, finding the minimum set of "authors" (contributors with DOA above 0.75) needed to cover more than half of all files.
Target a bus factor of at least 3 for critical repositories. A bus factor of 2 is a yellow flag, indicating thin coverage that one departure makes critical. A bus factor of 1 is a red flag, meaning a single departure could cause serious problems. This is the single most important resilience metric.
Orphaned File Percentage
Orphaned files are those where no active contributor has DOA above 0.5, meaning no one truly owns them anymore. Calculate this by counting files where maximum DOA across all contributors falls below the threshold, divided by total files.
Target less than 10% orphaned files. Between 10% and 20% is concerning. Above 20%, or an increasing trend, is a red flag requiring attention.
Orphaned files represent unmaintained code. Bugs take longer to fix because no one has context. Changes carry elevated risk because no one fully understands the implications. Tracking this metric reveals knowledge that's been lost and needs rebuilding.
Single-Author File Percentage
Single-author files have been modified by only one contributor throughout their history. Count them and divide by total files.
Target less than 25% of files. Between 25% and 50% is a yellow flag. Above 50% is critical, as extensive portions of your codebase are one departure from becoming orphaned.
Distribution Metrics
Gini Coefficient
The Gini coefficient measures commit distribution inequality on a 0-to-1 scale, where 0 is perfect equality and 1 is total concentration.
Target below 0.5 for healthy teams. Between 0.5 and 0.7 is a yellow flag. Above 0.7 is a red flag indicating that a few contributors dominate output while others contribute minimally.
Interpret Gini with context. A coefficient of 0.3 indicates a well-distributed team where everyone contributes at roughly similar levels. A coefficient of 0.5 shows some senior contributors doing more, but work remains spread. A coefficient above 0.7 suggests dangerous concentration that raises key person dependency concerns.
Repository Coverage
Examine how many repositories each contributor has touched and how many contributors have touched each repository.
Target at least three contributors per repository for important systems. Watch for contributors who are sole experts on more than two critical repositories. Aim for a balance of generalists who work across systems and specialists who go deep.
Siloed contributors create knowledge islands. Cross-functional contribution builds resilience.
Engagement Metrics
Lifecycle Distribution
Lifecycle classification categorizes contributors by their engagement patterns. Peak contributors show consistent, high activity relative to their baseline. Ramping Up contributors are new and building context. Winding Down contributors show declining activity compared to prior periods. Dormant contributors haven't been active recently but haven't fully departed. Departed contributors have been inactive for over a year.
Target more than 70% of contributors at Peak or Ramping Up stages. More than 20% Winding Down is a yellow flag. Multiple key contributors Winding Down simultaneously is a red flag requiring immediate attention.
Activity Rate
Track what percentage of contributors committed in the last 30 days. Baseline this for your organization, since what's normal varies by team size and project type.
Watch for sudden drops in activity rate. They may indicate morale issues, blocked work, or competing priorities. Gradual decline might suggest growing disengagement across the team.
Contributor Retention
Track departures over time and their knowledge impact. Metrics include departures per quarter, average bus factor impact of each departure, and time-to-productive for new hires (how long until they reach Peak stage).
High departure rates combined with high bus factor impact per departure signals accelerating knowledge loss that threatens organizational capability.
Sustainability Metrics
Churn Ratio
Churn ratio is lines deleted divided by lines added over a time period.
Ratios between 0.1 and 0.3 indicate mostly additive work, typical for new features. Between 0.3 and 0.7 suggests healthy balance of creation and refactoring. Between 0.7 and 1.0 indicates significant refactoring or technical debt paydown. Above 1.0 means more deletion than addition, possibly indicating rework or scope reduction.
Watch for sustained ratios below 0.1 (no refactoring happening, technical debt accumulating) or sustained ratios above 1.0 (excessive churn suggesting possible quality issues).
After-Hours Work
Track what percentage of commits occur outside business hours, typically defined as before 8 AM or after 6 PM local time.
Target less than 15% of commits during these hours. Between 15% and 30% is a yellow flag. Above 30% sustained over time is a red flag.
Occasional after-hours work happens for various reasons, including releases, incidents, and personal schedule preferences. Sustained high percentages indicate deadline pressure, understaffing, or burnout risk that threatens long-term sustainability.
Weekend Work
Track what percentage of commits occur on Saturday or Sunday.
Target less than 10% of commits. Between 10% and 20% is concerning. Above 20% sustained over multiple quarters is a strong signal of unsustainable pace or crunch culture.
Weekend work is a powerful signal because it's rarely necessary for healthy teams. Sustained weekend work indicates either chronic understaffing or cultural problems that will eventually cause attrition.
Building a Composite Health Score
Individual metrics provide detail. Composite scoring provides executive-level summary for comparison and tracking.
The approach is to normalize each metric to a 0-100 scale, weight by organizational priorities, and aggregate into a single score.
ContributorIQ's Organization Health Score uses equal weighting across four components: Bus Factor Score (25%), Single Author Score (25%), Gini Score (25%), and Activity Score (25%). The resulting 0-100 score enables quick assessment: 70-100 indicates healthy organizations, 50-69 suggests moderate risk needing attention, 30-49 is concerning with significant concentration, and below 30 represents critical organizational risk.
Use composite scores for comparison across teams and organizations, tracking trends over time, setting measurable goals for improvement, and communicating health to stakeholders who need single-number summaries.
Implementing Health Metrics
Start Simply
Don't try to track everything at once. In the first week, calculate bus factor for critical repositories, because this single metric reveals your most important risks. In the second week, add lifecycle classification to understand engagement patterns. In the second month, implement distribution metrics like Gini and single-author tracking. In the second quarter, add sustainability metrics for a complete picture.
Avoid Common Pitfalls
Don't use metrics punitively. Health metrics identify risks, not blame. Using them against individuals destroys trust and encourages gaming.
Remember that context matters. A new team has different profiles than an established one. Compare against appropriate baselines, not arbitrary standards.
Trends matter more than snapshots. A score of 45 that's improving is better than a score of 55 that's declining. Track direction, not just position.
Combine quantitative with qualitative. Metrics inform conversations; they don't replace judgment. Use data to identify where to focus attention, then apply human understanding to determine appropriate responses.
Measuring Organization Health with ContributorIQ
Building the measurement infrastructure described in this article from scratch requires significant engineering effort: extracting data from version control, computing DOA scores, classifying lifecycle stages, calculating Gini coefficients, and assembling everything into a coherent dashboard. ContributorIQ provides all of this out of the box. Connect your GitHub organization, and within minutes you have a complete health assessment covering all four dimensions: resilience, distribution, engagement, and sustainability.
The organization risk overview consolidates your most critical health signals into a single dashboard. Bus factor scores, orphaned file percentages, single-author risk, and overall health ratings are presented for every repository, with color-coded indicators that make it easy to identify problem areas at a glance. Engineering leaders can use this view for quarterly health reviews, while due diligence teams can assess acquisition targets without weeks of manual analysis.
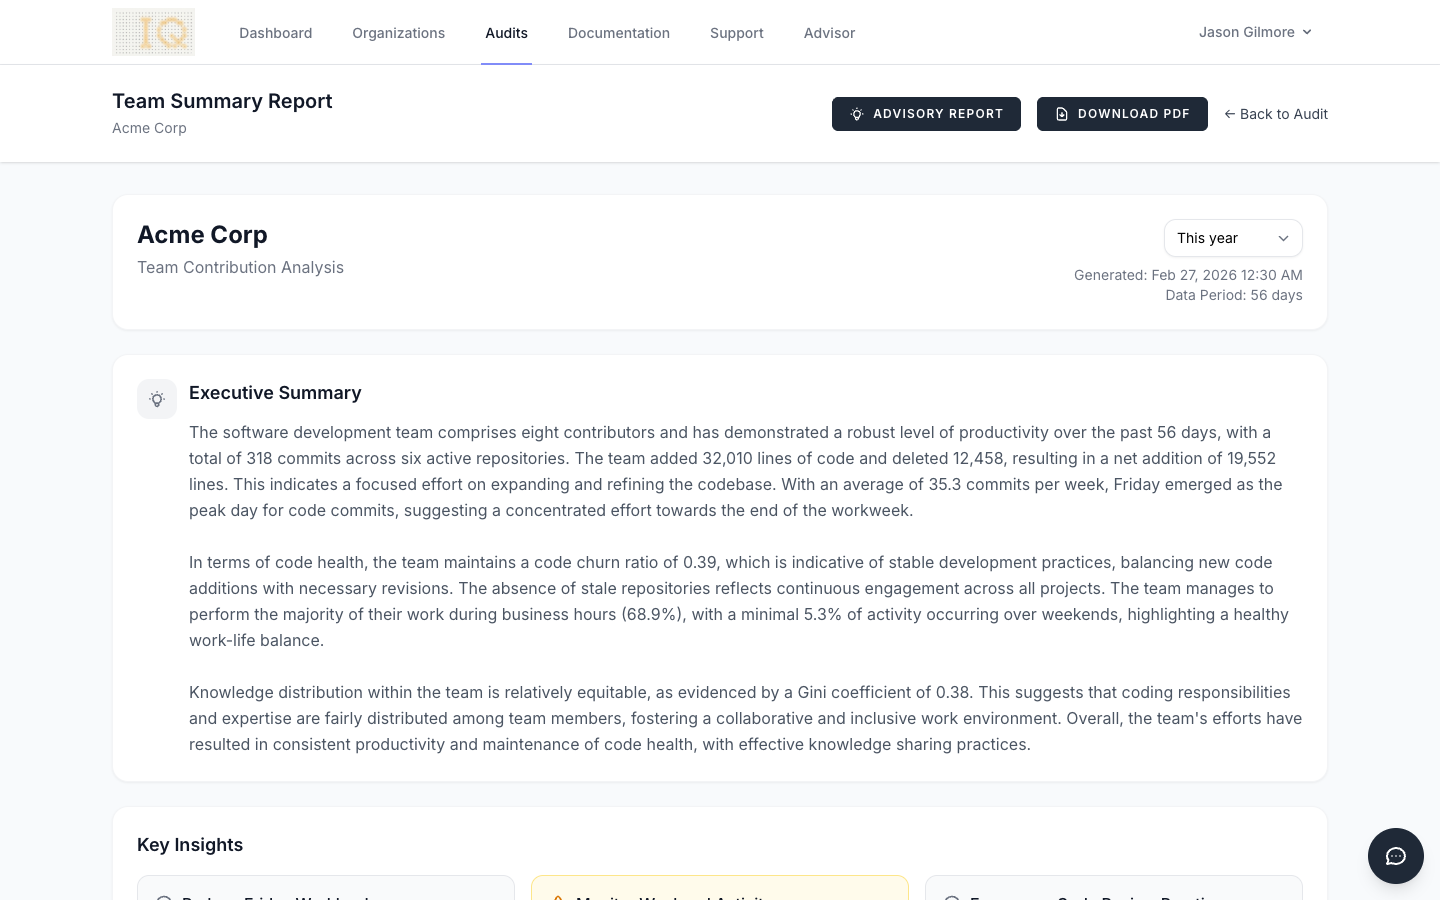
The team summary report brings distribution and engagement metrics together. Gini coefficients, contributor lifecycle breakdowns, and activity rates are displayed alongside contributor counts and commit volumes. This view answers the questions that matter most for ongoing team management: is knowledge spreading or concentrating? Are contributors engaged or disengaging? Is the organization becoming more resilient or more fragile over time?
Tools for Tracking Engineering Health Across Organizations
Tracking engineering health at scale requires tools that can analyze data across many repositories and teams simultaneously. Manual approaches (pulling git logs, building spreadsheets, calculating metrics by hand) don't scale beyond a few repositories and quickly become stale.
Effective engineering health tracking tools share several characteristics. They connect directly to version control systems (GitHub, GitLab) to extract contribution data automatically. They compute derived metrics like bus factor, Gini coefficients, and lifecycle classifications without manual intervention. They present findings in dashboards that serve both engineering managers (who need repository-level detail) and executives (who need organization-level summaries). They update continuously so that health assessments reflect current reality rather than a point-in-time snapshot.
For large organizations managing dozens or hundreds of repositories, the ability to aggregate health metrics across the entire engineering organization is critical. Individual repository health matters, but patterns that emerge across the organization (systemic knowledge concentration, widespread engagement decline, or consistent single-author risk in certain teams) are often more actionable than isolated findings.
ContributorIQ is purpose-built for this use case. It connects to your GitHub organization and calculates bus factor, contributor lifecycle stages, Gini coefficients, single-author file percentages, orphaned file rates, and composite health scores across every repository. The Organization Risk Overview provides a single dashboard where engineering leaders can compare health metrics across all teams and repositories, identify systemic risks, and track improvement over time. For organizations evaluating acquisitions, the same tooling produces investment-ready assessments of engineering team risk.
Conclusion
Engineering health metrics provide early warning of problems that velocity alone misses. By tracking resilience (can we absorb change?), distribution (is knowledge spread appropriately?), engagement (are people actively involved?), and sustainability (is this pace maintainable?), you build visibility into risks that would otherwise remain hidden until they become crises.
The investment in measurement pays off when your next resignation, critical incident, or acquisition doesn't catch you unprepared. With health metrics in place, you can identify risks before they become emergencies, make informed decisions about hiring and team structure, set measurable goals for organizational improvement, and demonstrate engineering health to stakeholders who need confidence in technical capabilities.
Velocity tells you how fast you're going. Health metrics tell you whether you can sustain the pace and what happens when things change.