Private Equity Technical Due Diligence: 2026 Playbook
Code audits miss the real risk: the team that wrote the code. A PE playbook for assessing engineering team health before you sign the term sheet.
- Introduction
- The Gap in Standard Technical Due Diligence
- The Engineering Team Risk Framework
- Red Flags That Should Affect Valuation
- Structuring Deals Around Engineering Risk
- A Case Example
- Conducting Engineering Team Due Diligence
- Putting It Into Practice with ContributorIQ
- How PE Firms Evaluate a Company's Tech Stack During Due Diligence
- Common Issues Uncovered During Software PE Due Diligence
- How Software Companies Can Prepare for PE Due Diligence
- Conclusion
Introduction
Software companies now represent a significant portion of private equity deal flow. The pandemic accelerated digital transformation across industries, and PE firms followed the value into technology investments. But software assets carry risks that traditional due diligence frameworks weren't designed to assess.
The fundamental challenge is that software isn't static. Code requires ongoing maintenance by people who understand it. When those people leave (whether immediately post-close or during the hold period), the value of the code degrades. A perfectly architected system becomes a liability when no one can safely modify it.
This guide provides a framework for PE professionals to assess engineering team risk, the human factor that often determines whether a software acquisition succeeds or struggles.
The Gap in Standard Technical Due Diligence
Standard technical due diligence typically engages a firm to assess code architecture, security vulnerabilities, technical debt, and technology stack currency. These assessments answer an important question: "Is the code good?"
But they don't answer the question PE professionals really need answered: "Will anyone be able to maintain and extend this code after we close?"
PE professionals have seen the post-acquisition surprises that result from this gap. The architect departure scenario: the lead architect who designed the entire system leaves 90 days post-close, and suddenly nobody understands how the core platform works. The orphaned critical system: due diligence showed a profitable billing system, but post-close you discover the only person who understood it left six months before the deal, and bugs now take five times longer to fix. The engagement cliff: key engineers were disengaging during diligence but nobody noticed, and half the senior team resigns within the first year.
These scenarios represent real value destruction that better due diligence could have identified and either avoided or priced appropriately.
The Engineering Team Risk Framework
Assessing Key Person Dependencies
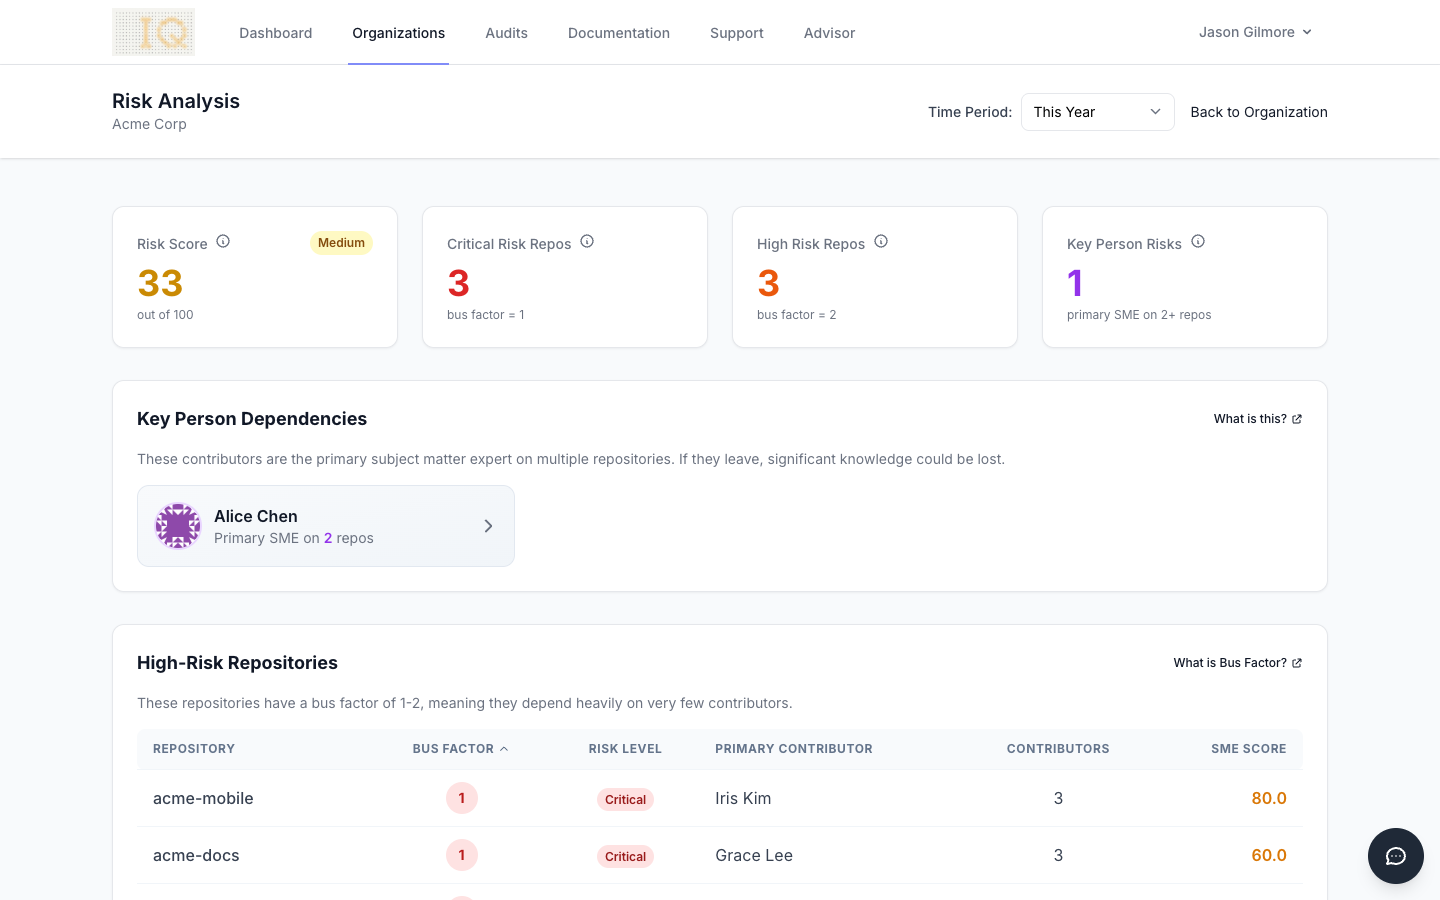
The first dimension measures reliance on specific individuals for critical knowledge. Start by calculating bus factor for each repository, which measures the minimum number of people who would need to leave before a system becomes unmaintainable. Identify repositories where bus factor equals 1 and map those critical systems to named individuals. Cross-reference those individuals against retention agreements.
The key questions to answer: How many critical systems depend on a single engineer? Are those engineers locked into retention arrangements? What's the likely cost if they leave despite retention efforts?
Red flags include bus factor of 1 on revenue-generating systems, key contributors not included in retention packages, and frequent mentions of "tribal knowledge" during management presentations.
Evaluating Contributor Engagement
The second dimension examines engagement levels across the engineering team using lifecycle analysis. Peak contributors show active, consistent contribution patterns. These are your stable performers. Ramping Up contributors are new and building context, which is normal for growing teams.
The concerning classification is Winding Down, which describes contributors whose recent activity is significantly lower than their historical baseline. This pattern often precedes departure. If key knowledge holders are Winding Down and not locked into retention agreements, you face immediate post-close risk.
Red flags include multiple key contributors classified as Winding Down, high ratio of Departed to Peak contributors (suggesting ongoing turnover), and very few Peak contributors overall (suggesting team instability).
Measuring Knowledge Concentration
The third dimension quantifies how evenly knowledge spreads across the team. The Gini coefficient measures commit distribution inequality. Values below 0.5 indicate healthy distribution. Between 0.5 and 0.7 suggests moderate concentration worth investigating. Above 0.7 indicates significant concentration, where most of the codebase is maintained by very few people.
Single-author files (code modified by only one contributor) represent knowledge that's one departure from becoming orphaned. Percentages below 25% are acceptable; 25-50% is concerning; above 50% represents critical risk.
Orphaned files (code where no active contributor has meaningful ownership) represent knowledge already lost. The question isn't if these areas will cause problems; it's when.
High concentration means knowledge lives in few heads, departures have outsized impact, and scaling is constrained by the availability and willingness of key individuals.
The Composite Health Score
For executive-level comparison across portfolio and pipeline, composite scoring provides a single metric that captures multiple dimensions.
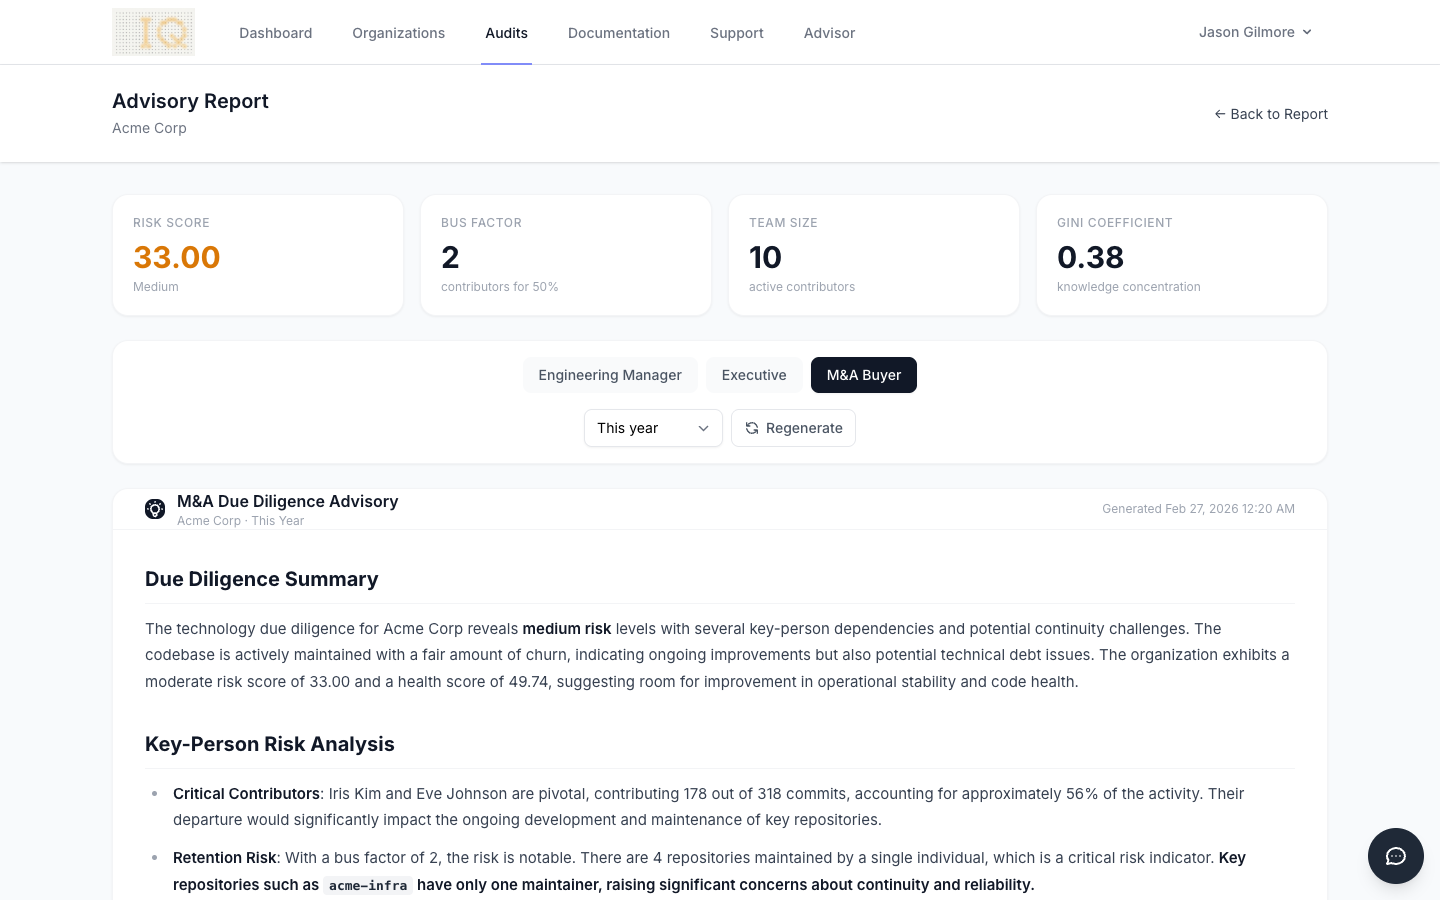
ContributorIQ's Organization Health Score combines bus factor analysis, single-author file tracking, Gini measurement, and activity assessment into a 0-100 score. Scores of 70-100 indicate healthy organizations where you can proceed normally. Scores of 50-69 suggest moderate risk that should factor into integration planning. Scores of 30-49 are concerning, and price adjustment or earnout structuring may be warranted. Scores below 30 represent critical risk; consider walking away or major repricing.
Red Flags That Should Affect Valuation
Some findings warrant walking away entirely or significant repricing. These critical findings include bus factor of 1 on revenue-critical systems (where one departure stalls the business), organization health scores below 30 (severe knowledge concentration), key knowledge holders classified as Winding Down who aren't in retention agreements (high flight risk), more than 30% orphaned files (significant unmaintained code), and single contributors owning more than 40% of all commits (extreme concentration).
Moderate findings warrant price adjustment or earnout structuring: bus factor of 2 on important systems (thin but manageable coverage), health scores between 30 and 50 (needs attention but recoverable), Gini coefficient above 0.6 (notable concentration), limited documentation culture (knowledge transfer will be expensive), and key contributors approaching vesting cliffs (elevated flight risk).
Yellow flags warrant monitoring post-close rather than affecting deal terms: several contributors in Ramping Up stage (normal growth pattern), bus factor of 3-4 on secondary systems (room for improvement), moderate single-author percentage between 15% and 25% (watch for trends), and documentation that exists but is stale (will need refresh).
Structuring Deals Around Engineering Risk
Knowledge concentration risk has financial implications that should affect deal structure.
For valuation adjustments, consider that a health score of 30 versus 70 represents meaningful integration risk, in the range of 5-15% discount for critical scores. If 50% of knowledge lives in people without retention agreements, that's a valuation issue, not just an integration challenge. Undocumented systems require investment to stabilize; budget $50-100K per critical system for documentation and cross-training.
For earnout design focused on named employee retention, identify specific individuals whose retention is critical and tie earnout percentage to their continued employment. For example, "50% of Year 2 earnout tied to retention of three named engineers." This creates aligned incentives and protects against the most obvious risk.
Knowledge transfer milestones provide another earnout mechanism: "Secondary contributor identified for all tier-one systems by Month 6," "Bus factor of at least 2 on all critical repositories by Month 12," "Documentation complete for listed systems by Month 9." These milestones drive behavior that reduces risk over the hold period.
Health score improvement requirements link earnout to organizational resilience: "Organization Health Score must reach 60 by end of Year 1." This provides ongoing incentive to address concentration rather than letting it persist.
For representations and warranties, consider engineering-specific provisions: disclosure of any systems with bus factor of 1, confirmation that the key employee schedule is accurate and complete, representation that no key contributor has indicated intent to leave, and warranty that material systems have documentation sufficient for a competent engineer to maintain.
A Case Example
Consider a mid-market PE firm evaluating a $50M acquisition of a vertical SaaS company. Financial due diligence showed attractive fundamentals: $8M ARR growing 25% year-over-year, 90% gross retention, and strong unit economics.
Technical team due diligence revealed different picture. Bus factor analysis showed the core platform had bus factor of 1, and that single contributor owned 65% of commits to the main repository. Lifecycle classification showed that key contributor was Winding Down, with activity declining 60% over the past quarter. Knowledge distribution analysis showed 38% of files were orphaned, and the Gini coefficient was 0.74. The composite health score was 32 out of 100, in the critical range.
The deal was restructured based on these findings. Purchase price was reduced 20% to reflect integration risk. An earnout was added tied to two-year retention of three named engineers. Milestone payments were linked to health score improvement. The seller was required to complete a documentation sprint before close.
Post-close, the key contributor did leave at Month 8. But the documentation and cross-training completed pre-close meant the system remained maintainable. Without the diligence findings, this departure would have been a crisis. With them, it was a manageable transition.
Conducting Engineering Team Due Diligence
The process follows a structured approach. First, get repository access by requesting GitHub App installation from the target with read-only access to production repositories. Position this as standard technical diligence. It requires target cooperation but shouldn't be controversial.
Second, run automated analysis using ContributorIQ or similar tools to generate bus factor for all repositories, classify contributors by lifecycle stage, calculate organization health scores, and identify orphaned and single-author files.
Third, validate findings through interviews. Data informs questions; interviews validate and explain. "We noticed this contributor is the only person touching this system. What's the succession plan?" "Several key contributors appear to have declining activity. Are there organizational changes we should know about?" "How do you handle knowledge transfer when someone leaves?"
Fourth, document and present findings in investment committee-ready materials: executive summary of engineering risk, quantified metrics with benchmarks, recommendations for deal structure, and post-close integration requirements.
Putting It Into Practice with ContributorIQ
Executing the engineering team risk framework described above requires extracting and analyzing data from across the target's repositories. ContributorIQ streamlines this process by connecting to GitHub and producing investment committee-ready analysis automatically. Once the target installs the GitHub App (read-only access), ContributorIQ calculates bus factor for every repository, classifies each contributor by lifecycle stage, computes Gini coefficients, and generates a composite Organization Health Score.
The M&A Advisory Report packages these findings into a format PE professionals can use directly in deal evaluation. It highlights critical risk areas, names the specific contributors who hold concentrated knowledge, and provides the quantitative evidence needed to support valuation adjustments, earnout structuring, and retention planning.
The Organization Risk Overview provides portfolio-level visibility into engineering health across all analyzed organizations. For firms managing multiple deals in their pipeline, this view makes it simple to compare engineering risk across targets and prioritize diligence efforts where they matter most.
Rather than engaging a separate technical due diligence firm for weeks of manual analysis, PE teams can generate quantitative engineering risk assessments in a fraction of the time, then use those findings to drive more targeted management interviews and structure deals that account for the human factor.
How PE Firms Evaluate a Company's Tech Stack During Due Diligence
Tech stack evaluation in PE due diligence goes beyond listing languages, frameworks, and cloud providers. The real question is whether the technology choices are sustainable and whether the people who built the stack will be around to maintain it.
A thorough tech stack evaluation covers four areas. First, technology currency: are frameworks and dependencies actively maintained, or is the stack built on end-of-life technologies that will require expensive migration? Second, architecture scalability: can the system handle the growth projections in the investment thesis without a rewrite? Third, operational maturity: are there CI/CD pipelines, monitoring, alerting, and incident response processes in place? Fourth, and most critically, knowledge sustainability: does the team that built the stack have enough shared understanding to maintain and extend it, or does critical knowledge live in one or two heads?
PE firms that only evaluate the first three areas miss the factor that most often determines post-acquisition outcomes. A modern, well-architected stack becomes a liability if the only people who understand its internals leave after the deal closes. This is why engineering team risk analysis, covering bus factor, contributor lifecycle, and knowledge distribution, should be a standard component of every tech stack evaluation.
Common Issues Uncovered During Software PE Due Diligence
After analyzing engineering teams across dozens of software acquisitions, several patterns emerge repeatedly.
Founder-dependent codebases. In many founder-led software companies, the original founder still owns 50-70% of commits to core systems. This creates extreme bus factor risk, especially when the founder plans to exit after an earnout period. If knowledge transfer hasn't happened before the deal, it rarely happens after.
Invisible knowledge loss. Companies often don't realize critical knowledge has already left. Orphaned files (code where no active contributor has meaningful ownership) accumulate silently. By the time a bug surfaces in an orphaned system, there's nobody who can fix it efficiently. Due diligence frequently reveals orphaned file percentages above 30%, which signals that maintenance costs will be higher than the seller represents.
Engagement decline masked by velocity. Teams can maintain sprint velocity while key engineers mentally check out. Contributor lifecycle analysis often reveals that senior engineers are in a Winding Down stage, with activity declining 40-60% from their baseline. These engineers are likely interviewing elsewhere, and their departure will create knowledge gaps that won't be apparent from velocity metrics alone.
Documentation theater. Many companies claim to have documentation, but due diligence reveals it's outdated, incomplete, or describes aspirational architecture rather than what's actually running. True knowledge transfer requires more than wiki pages.
Concentrated code review bottlenecks. When one or two engineers must approve every pull request in a critical area, that's both a velocity constraint and a knowledge concentration signal. If those reviewers leave, the team loses both quality control and the deepest system understanding.
How Software Companies Can Prepare for PE Due Diligence
Sellers who proactively address engineering team health before going to market earn stronger valuations and smoother deal processes.
Start by measuring your baseline. Run a bus factor analysis across all repositories and identify any systems with a bus factor of 1. Calculate your Organization Health Score and understand where you fall on the 0-100 scale. Review your contributor lifecycle distribution to verify that key engineers are engaged and at Peak status.
Then address the most critical gaps. Cross-train a second engineer on every bus-factor-1 system. Ensure architectural decisions are documented with enough context that a competent engineer could maintain the system independently. Put retention agreements in place for engineers who hold concentrated knowledge.
When due diligence begins, a healthy engineering organization signals lower acquisition risk. Buyers who see strong health metrics, distributed knowledge, and engaged contributors will pay more and impose fewer earnout constraints. The investment in engineering health pays for itself at the negotiating table.
Conclusion
Technical due diligence for software acquisitions must evolve beyond code audits to assess the human factor. The questions that matter for PE investors are fundamentally about people: Who understands this code? Will they stay? What happens if they don't?
By systematically analyzing bus factor, contributor lifecycle, and knowledge distribution, PE firms can identify risks that traditional diligence misses, price deals appropriately for engineering risk, structure earnouts that protect against knowledge loss, and plan integration with realistic expectations.
The best deals are those where buyers understand what they're acquiring, including the people who make the code work and the risks if those people don't stay.